|

Figure 2는 maXis의 high resolution, high accuracy의 단백질 data를 보여준다.
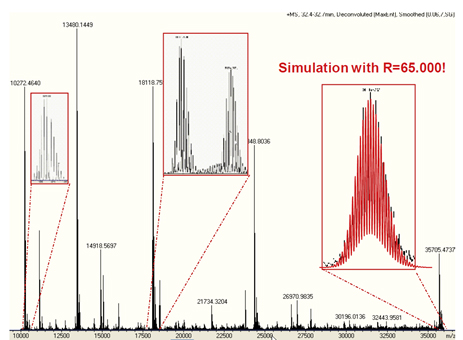
Figure 2. Maximum Entropy deconvoluted mass spectrum of an LC/MS run of intact E- coli proteins at the retention time of ca. 32 min. All co-eluting proteins in the mass range of 10 - 36 kDa are isotopically resolved. The experimental signal at 36 kDa (right inset) is in perfect agreement with the theoretical isotope pattern of this compound at a simulated resolution of 65,000.
Figure 3은 IgG의 주요 heterogeneous glycosylation patterns을 나타내었으며 이는 2ppm이내로 높은 질량 정확도를 나타낸다. glycosylation isoform은 162Da의 분자량 차이를 나타내며 이는 galactose unit을 나타내고 있다.
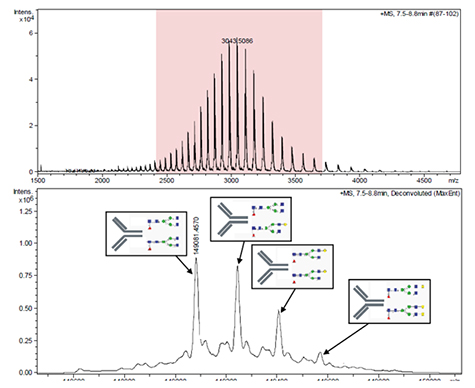
Figure 3. The mass spectrum before and after charge deconvolution applying the Maximum Entropy algorithm. The mass deviation between measured and theoretical mass is better than 2 ppm. The high resolving power of maXis rapidly identified heterogeneous glycosylation patterns; the major glycosylated species have been annotated.
maXis가 제공하는 high resolution data는 샘플 전처리 중 생성된 modification의 명확한 동정이 가능하게 한다. Figure 4에서 *로 표시되는 peak(=57Da로 시프트된 피크)는 알킬화 단계에서 유래 된 원치 않는 과알킬화 부산물을 나타낸다.
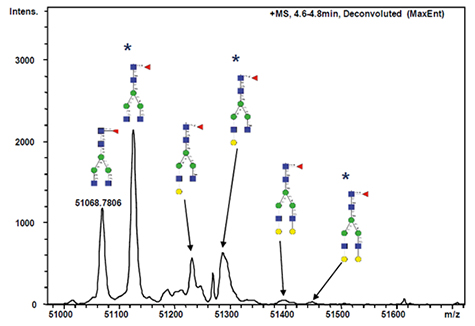
Figure 4. Maximum Entropy deconvoluted spectrum of the released heavy chain of the human IgG1. Taking into account average atomic weights from organic sources, the calculated mass of the mass labeled glycosylation form is 51,068.88 Da, which deviates less than 2ppm from the measured mass. Annotated peaks labeled with * (peak shifts of 57 Da) represent chemical artifacts due to overalkylation.
또한, 비공유결합을 가진 단백질 복합체도 maXis로 분석 할 수 있다. Figure 5에서 IgG와 25 kDa을 가지는 다른 단백질간의 상호 작용을 관찰할 수 있다. maXis는 1,000 ~ 7,000 m/z 범위에서 높은 이온 투과율을 나타내며 deconvoluted 스펙트럼에서 172 kDa의 비공유결합을 가지는 복합체가 관찰되었으며, 이는 IgG와 단백질의 복합체를 나타내고 있다.
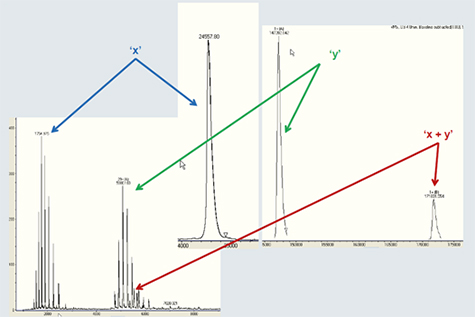
Figure 5. Example of a study on a non-covalent complex formed by a monoclonal antibody and a protein of 25 kDa molecular weight. Protein signals appear in the wide m/z range of 1,000 - 7,000 (left), requiring a mass spectrometer with a high transmission in that range. After deconvolution (right) of the raw data, signals of both individual components as well as the entire complex at 172 kDa are observed. Samples are courtesy of CIPF (Centre d’Immunologie Pierre Fabre).
Figure 6a는 intact protein의 ETD를 이용한 maXis의 탁월한 성능을 보여준다. m/z 714을 가지는 Ubiquitin의 +12 precursor ion(분자량 8565Da)이 quadrupole에서 isolation 되고 reaction cell에서 fragmentation되었다. +6 및 +10의 전하 상태 사이에서 다양하게 대전된 fragment ion을 갖는 ETD 스펙트럼의 일부를 표시하였다. Figure 6a에서 볼 수 있듯이, 높은 resolution으로 모든 peak들의 동위 원소 pattern을 확인 할 수 있다. 분자량이 831일 때 resolution은 40,000으로 계산되었다.
Figure 6b는 mascot database search 결과를 나타낸다. 거의 모든 아미노산 서열을 동정 할 수 있으며 (coverage 약 90 %), 8565 Da의 precursor로 부터 거의 모든 peptide fragmentation이 관찰된다. Ubiquitin은 mascot에서 score가 343으로 확인된다. 모든 fragmentation ion은 최대 8.5 kDa의 질량 범위에서 ±2.5 ppm 이내의 정확성을 나타내며, 평균 오차 (RMS)는 1 ppm이다. MS와 MS/MS 결과에 대한 높은 감도와 질량 정확도는 정확한 단백질의 서열 정보를 제공한다. 높은 질량 분해능, 높은 질량 정확도 및 우수한 ETD 효율이 maXis가 top-down 단백질 분석을 위한 이상적인 도구임을 알려준다.
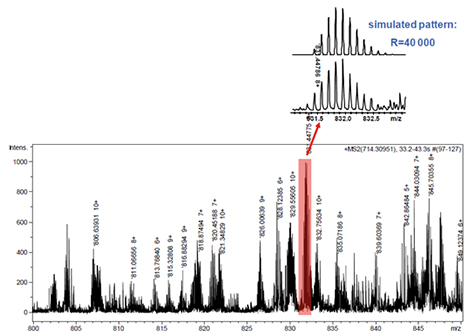
Figure 6a. Zoom of the entire ETD-MS/MS spectrum of intact Ubiquitin (MW 8565 Da). All observed fragment ions with charge states between +6 and +10 are clearly isotopically resolved. The comparison of the experimental signal at m/z 831 with the simulated isotope pattern of this fragment (top) shows that the instrument has a mass resolution of the fragments in the range of R = 40,000.
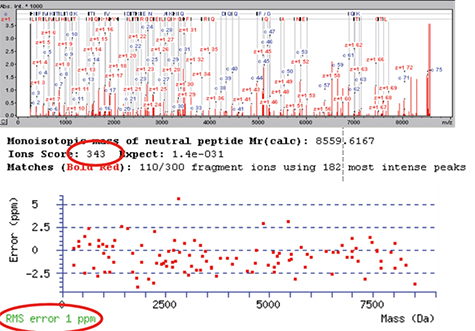
Figure 6b. Result of the Mascot database search on the ETD spectrum of intact Ubiquitin. The peak annotation within biotools (top) shows almost complete sequence coverage from the intact mass of 8565 Da down to ca. 200 Da. The Mascot score of 343 (middle) represents the highly confidential identification of Ubiquitin. The average mass error of all fragments is 1 ppm (bottom), i.e. the maXis shows similar mass accuracies for both MS and MS/MS spectra.
Figure 7a은 분자량 약 80 kDa을 가지는 당단백질인 Serotransferrin을 maXis-ETD를 이용하여 intact 분석을 수행한 결과이다. maXis의 quadrupole은 m/z 2271에서 +35 precursor ion을 isolation 할 수 있었다. Product ion은 대부분 라디칼이며, +4에서 +13 사이의 매우 다양한 fragmentation ion을 정확히 분리하였다. Figure 7b는 biotools software에서 ETD MS/MS 스펙트럼의 아미노산 서열을 나타낸다. 아미노산 A51과 S117 사이의 서열이 밝혀졌으며 Serotransferrin은 disulfide bond에 의하여 상호 연결되어있는 것을 확인 할 수 있다. C48과 C118의 서열을 확인 할 수 있는데 이는 disulfide bond에 의해 결합되어 있지 않은 Serotransferrin 내의 유일한 영역임을 알 수 있다. 완전한 특징 분석을 위해 단백질은 top-down방법으로 분석되어야 하고 본 연구를 통하여 maXis-ETD가 50 - 100kDa 범위의 단백질의 top-down sequencing을 위한 최적화된 장비임을 입증 할 수 있다.
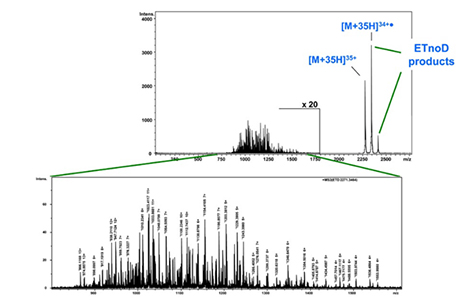
Figure 7a: Raw ETD-MS/MS spectrum of intact Serotransferrin (MW ca. 80 kDa). After isolation and fragmentation of the +35 charged ions at m/z 2271, multiple fragment ions appear in the m/z range 750 - 1750 with charge states of +4 to +13.
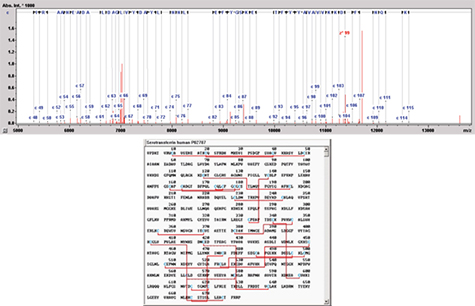
Figure 7b: Annotation of the amino acid sequence in Biotools after successful Mascot database search (top). A sequence tag in the mass range of 5000 - 13,000 Da is observed. Serotransferrin is highly protected by 19 disulfide bridges, represented by the red lines in the sequence (bottom). The observed tag is marked in yellow in the primary structure and is the only part which is not highly cross-linked: therefore it can be fragmented successfully.

Top-down sequencing은 enzymatic digestion을 필요로 하지 않고 intact protein의 확인 및 특징 분석을 가능하게 한다. 또한 top-down 접근법은 생물 치료제, MALDI Imaging 또는 quantitative proteomics 연구와 같은 다른 질량 분석 기술로 찾은 biomarker 단백질의 포괄적인 특징 분석에 이상적이다.
maXis UHR-TOF LC-MS에 결합 된 ETD는 탁월하고 고유한 성능을 제공한다. 높은 질량 분해능, 질량 정확도 및 높은 ETD 효율을 통해 생물 치료제, biomarker 연구에서 동정된 단백질 또는 단백질 혼합물에 대한 top-down 분석을 위한 이상적인 도구이다. Glycosylation pattern을 포함하여 최대 172kDa의 intact protein을 정확하게 동정 할 수 있었으며 2 ppm의 질량정확도 내에서 동정될 수 있으므로 신뢰도가 매우 높은 장비이며 top-down proteomics에 가장 최적화된 장비이다.
|