|
|
 |
A mass spectral profile of PHMGs with 1-MeIm-CHCA
- 1-MeIm-CHCA matrix를 이용한 PHMG 분석에서 figure 1과 같이 A,B,C,D 4 종류의 말단기를 가진 PHMG가 발견되었다(Scheme 2.). A,B,C는 선형의 구조를 보이며, D는 두개의 선형 고분자가 결합하고 있는 형태를 나타낸다. A,B,C,D 4 종류 외에도 고리형의 PHMG 형태가 보고되어 있다.
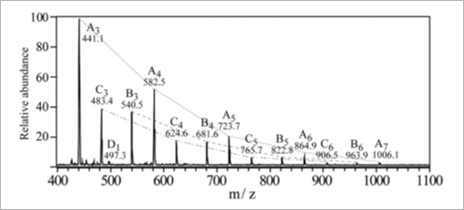
Figure 1. MALDI-TOF mass spectrum of PHMG oligomers obtained with the 1-MeIm-CHCA matrix. Series of oligomers of the same polymer type, e.g., types A, B, and C, are connected with a dotted line.
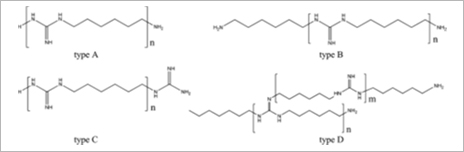 Scheme 2. Chemical structures of type A-D PHMG (reproduced fromWei et al.[5] with permission).
- A 이온인 [A3+H]+이온(m/z 441.1)이 가장 많이 검출 되는 것을 확인 할 수 있고 A,B,C type 모두 중량체가 많아 질 수록 감소 곡선이 나타내는 것을 확인 할 수 있다. PHMG 시료는 용액상태에서 2주가 지나면 고리형의 PHMG가 급격히 증가하여 정량분석이 힘들어 1~2일 안에 분석을 해야 정확한 결과를 얻을 수 있다.
- MALDI-TOF MS를 이용하여 PHMG 중합체의 이온들과 이온들의 분포를 확인 할 수 있었으며 이온들의 분포를 이용하여 통계적으로 수-평균 분자량(Mn)과 무게-평균 분자량(Mw) 및 다중분산도(PD)를 구할 수 있다. 이러한 스펙트럼의 통계적 계산은 Polytools 소프트웨어를 이용하여 계산하였다. |
|
|
Reproducibility
- PHMG를 정량 분석하기 앞서 CHCA와 1-MeIm-CHCA matrix에서의 sample-to-sample, spot-to-spot의 신호 재현성 연구를 선행하였다.
- 1-MeIm-CHCA matrix를 이용한 재현성 실험에서 sample-to-sample의 재현성은 3 % 미만, spot-to-spot 재현성 역시 2%대의 RSD를 나타내었으나 CHCA를 이용하여 얻은 스펙트럼에서는 상대적으로 낮은 재현성을 보인다.
- 이는 1-MeIm-CHCA의 결정이 CHCA보다 균질하며 얇은 필름 형태를 형성하기 때문에 보다 높은 재현성을 나타낼 수 있다.
|
|
|
Quantifying PHMGs with 1-MeIm-CHCA and a peptide internal standard
- 정량분석을 위해서 내부표준물질은 분석하고자 하는 물질과 물리적, 화학적 성질이 유사하여 이온화 효과가 분석하고자 하는 물질과 비슷한 조건에서 일어나는 화합물을 사용해야 한다. 또한 m/z가 겹치지 않은 범위에서 유사한 m/z 범위로 검출이 되어야 한다.
- RRRK에서 아르지닌의 잔기는 PHMG와 같이 구아니딘 작용기가 포함되어 있어 PHMG와 구조적 유사성을 가지고 분자량은 614.3으로 PHMG oligomer와 유사한 범위에서 방해하지 않는 분자량을 지니고 있어 내부표준물질로 선택하였다.
- Figure 2에서는 1-MeIm-CHCA matrix를 사용하여 5개의 다른 농도의 PHMG spectra를 나타낸다. 내부표준물질은 빨간색으로 표시하였으며 각각 [RRRK+H]+, m/z 615.4와 [RRRK+Na]+ m/z 637.4를 각각 나타낸다.
- Figurer 3 (a) (b)는 각각 1-MeIm-CHCA와 CHCA matrix를 사용하여 얻은 검량선으로, 1-MeIm-CHCA가 CHCA에 비하여 높은 재현성과 적은 오차를 나타내는 것을 확인 할 수 있다. R2는 1-MeIm-CHCA가 0.9872, CHCA가 0.9187이며 1-MeIm-CHCA가 높은 직선성을 나타내는 것을 알 수 있다. 또한 RSD는 1-MeIm-CHCA에서 높은 유사성을 보인다.
|
|
|
Dependence on internal standards in PHMG quantitation
- 구아니딘기를 작용기로 가지지 않은 펩타이드를 내부표준물질로 사용 할 때와 펩타이드의 길이에 따라 어떤 차이를 보이는지를 확인 하기 위하여 내부 표준물질로 GGYAIAG, LSIGKV, 그리고 RRRRK를 내부표준물질로 하여 추가 검량선을 작성 하였다 (Figure 4.).
- Figure 4에서와 같이 펩타이드의 아미노산의 종류나 길이에 관계없이 내부 표준물질로 사용이 가능하다는 것을 알 수 있다. 모든 펩타이드 내부표준물질에서 R2는 거의 비슷한 결과를 보여주나 구아니딘 작용기를 포함하지 않은 펩타이드는 기울기에서 차이를 나타낸다. 이는 화학적 물리적 성질에 따른 감도차이에 의해 발생하는 것으로 여겨진다.
|
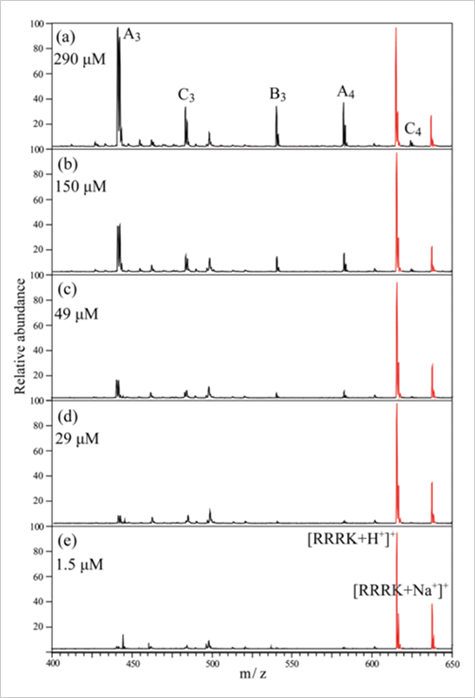
Figure 2. MALDI-TOF mass spectra of a PHMG sample acquired with an RRRK internal standard. The RRRK concentration was fixed at 0.1 mM and the PHMG concentrations were (a) 290 μM, (b) 150 μM, (c) 49 μM, (d) 29 μM, and (e) 1.5 μM. Peaks shown in red correspond to protonated and sodiated RRRK.
![Figure 3. Calibration plots for PHMG obtained with (a) 1-MeIm-CHCA and (b) CHCA matrices. The logarithmic ratio of the sum of peak areas and the peak area of the internal standard are plotted versus the logarithm of the PHMG concentration. [RRRK+H]+ and [RRRK+Na]+ peaks were used as the internal standard.](img/sub5_img5.jpg)
Figure 3. Calibration plots for PHMG obtained with (a) 1-MeIm-CHCA and (b) CHCA matrices. The logarithmic ratio of the sum of peak areas and the peak area of the internal standard are plotted versus the logarithm of the PHMG concentration. [RRRK+H]+ and [RRRK+Na]+ peaks were used as the internal standard.
![Figure 4. Calibration plots for PHMG samples obtained with (a) GGYAIAG, (b) LSIGKV, and (c) RRRRK internal standards at 0.1 mM. 1-MeIm-CHCA was used as the matrix for all MALDI-MS measurements. The protonated and sodiated peaks, [M+H]+ and [M+Na]+, were considered for the internal standard.](img/sub5_img6.jpg)
Figure 4. Calibration plots for PHMG samples obtained with (a) GGYAIAG, (b) LSIGKV, and (c) RRRRK internal standards at 0.1 mM. 1-MeIm-CHCA was used as the matrix for all MALDI-MS measurements. The protonated and sodiated peaks, [M+H]+ and [M+Na]+, were considered for the internal standard.
 |
|
|
PHMG는 영유아들의 폐 손상으로 인한 사망의 원인으로 지목 되었으며 아직도 물티슈와 같은 살균성 제품에 많이 사용되고 있어 PHMG의 정량 분석은 필수적이다. |
|
|
Ionic-liquid matrix인 1-MeIm-CHCA와 internal standard를 사용하여 성공적으로 PHMG oligomer를 MALDI-TOF를 이용한 정량을 할 수 있다. |
|
|
MALDI-TOF를 이용한 정량 분석에도 낮은 sample-to-sample, spot-to-spot variation으로 정확한 정량이 가능하다. |
|